Health services data from IRC’s Latin America programmes
Since mid-2024, IRC health teams in Ecuador, Peru, and Mexico have delivered
38,118 individual health services to
26,920 clients.
Respiratory infections and parasitosis dominate the primary care caseload;
migrant clients show markedly higher rates of acute stress and ITS compared to host communities.
The IRC has been delivering health programmes across Latin America since 2019. Since 2024, the IRC has been running consultations with clients in Ecuador, Peru, and Mexico, recording data on each encounter through a purpose-built health information system. While the IRC’s first priority is quality care, not data collection, these records make it possible to track caseloads, identify equity gaps, and understand how health needs are evolving across the populations we serve.
This factsheet presents those findings. One important caveat: everything here reflects what we see among IRC clients specifically — people who reached one of our clinics. It does not describe the broader population. The picture is shaped by who we are able to reach, not only by who needs care.
Where does the IRC work?
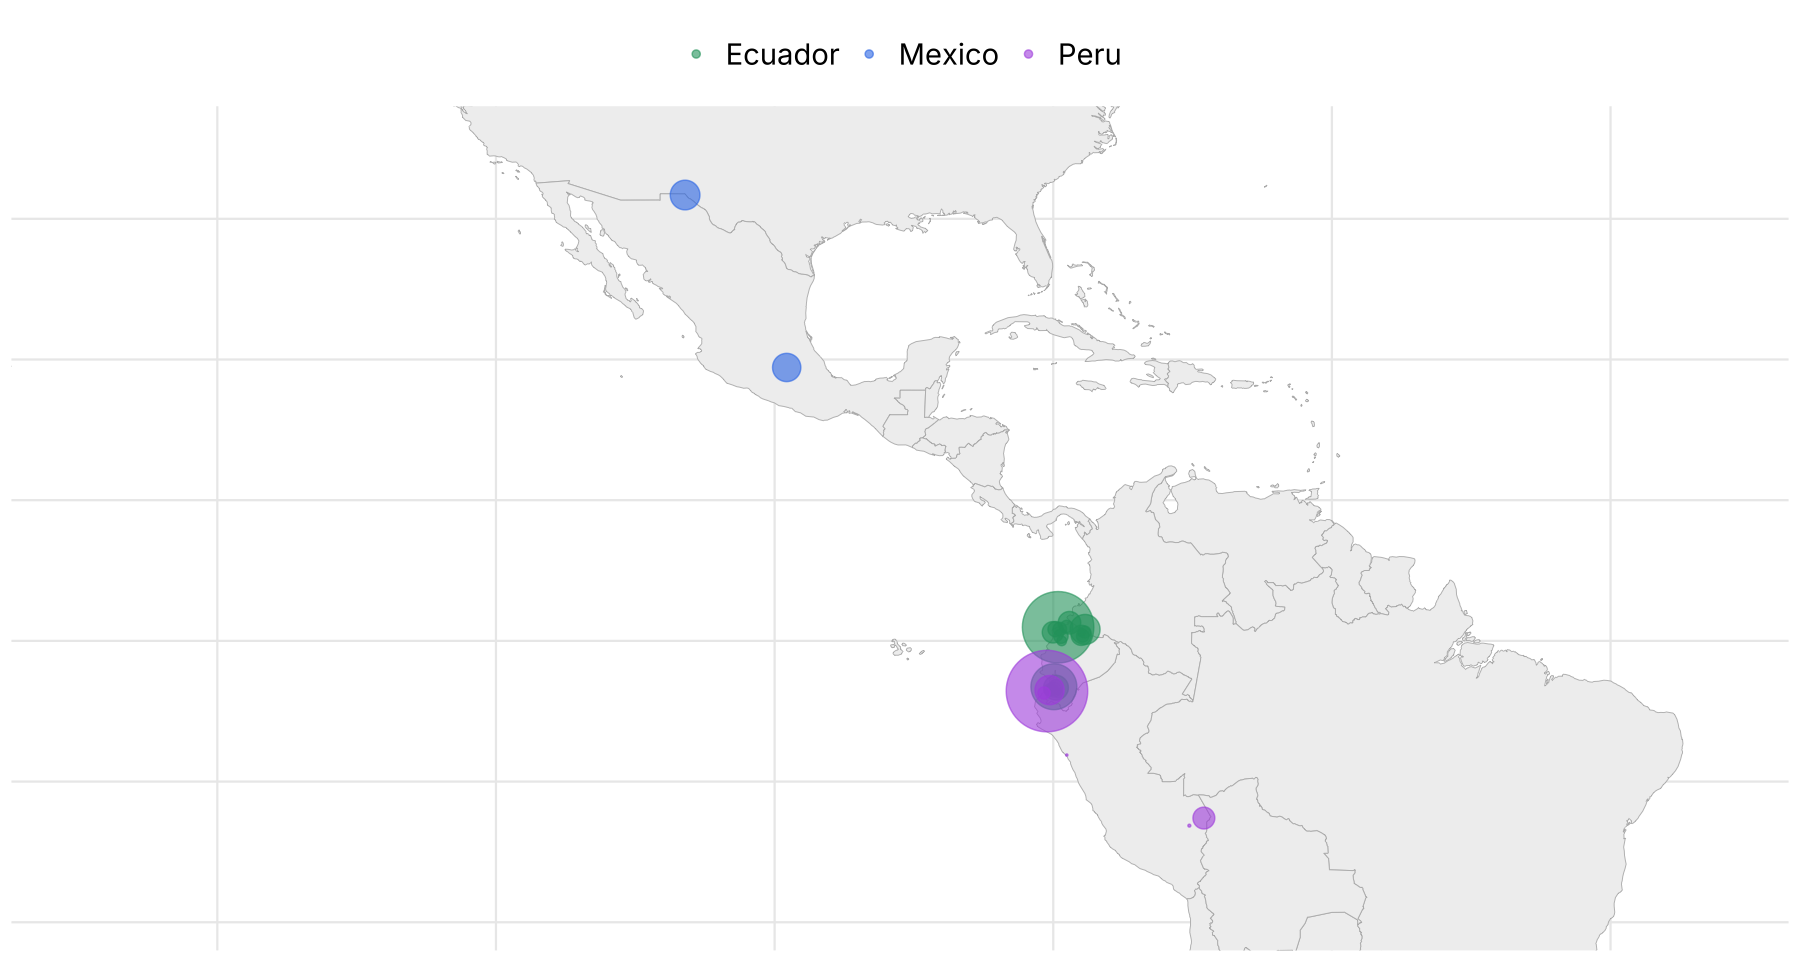
IRC health services are concentrated in urban centres along migration corridors and displacement-affected border areas. Each bubble on the map below represents one IRC service location; its size reflects the number of clients who registered and received at least one consultation. Locations where clients registered but never returned for a service are not shown.
Figure 1. The distribution of clients around Latin America
Map · bubble size = registered clients with at least one consultation
Clients
Total clients
26,920
Female
67%
Under 18
38%
Ecuador 🇪🇨
14,682
84% Ecuadorian nationals
Peru 🇵🇪
10,228
55% Venezuelan nationals
Mexico 🇲🇽
2,010
69% migrants / displaced
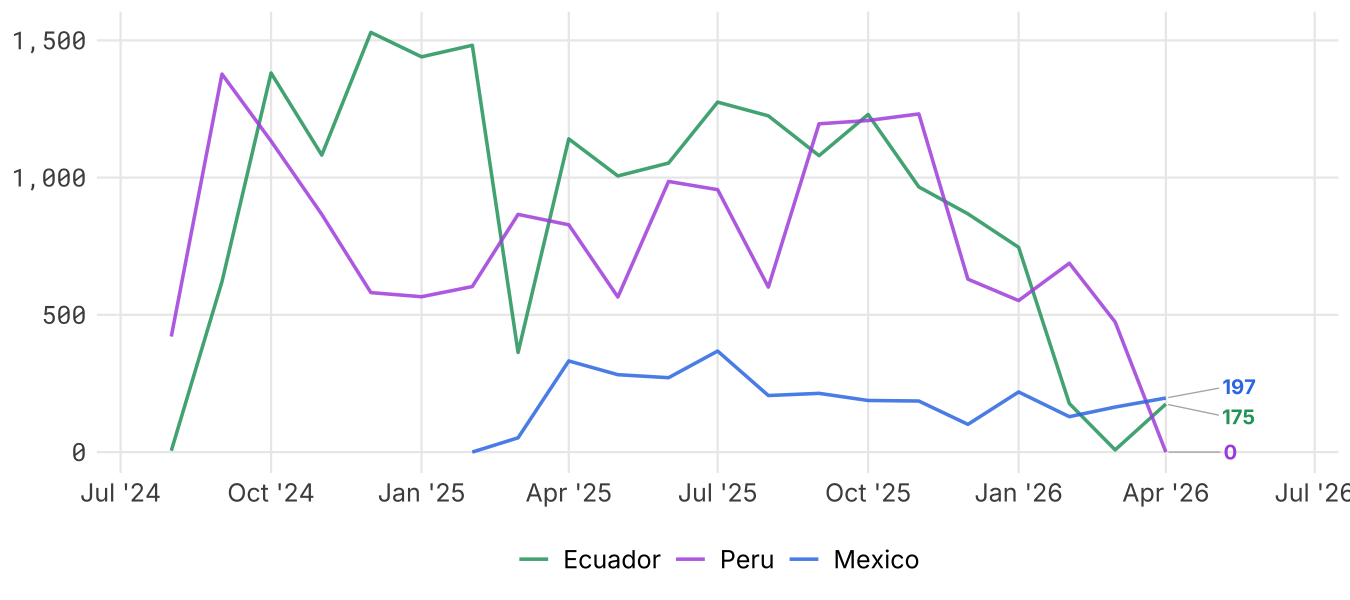
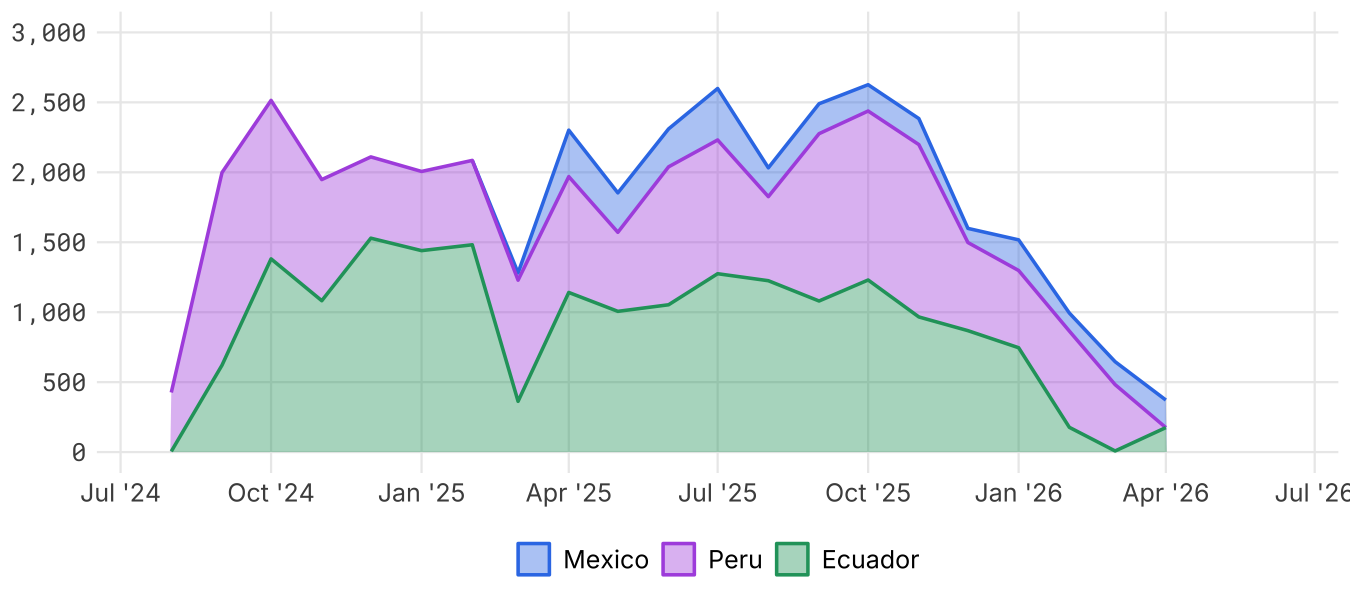
All three programmes have grown since their respective launches, but with distinct patterns. Ecuador is relatively stable — a mature programme serving a settled population. Peru is more variable month to month, consistent with a transit corridor where caseload fluctuates with migration flows. Mexico is the newest programme and has the least historical data.
Use the tabs below to compare trend lines side by side, or to view a stacked area chart that shows the combined regional total.
Figure 2. How has the caseload changed over time?
Line chart · monthly consultations per country, with stacked regional total
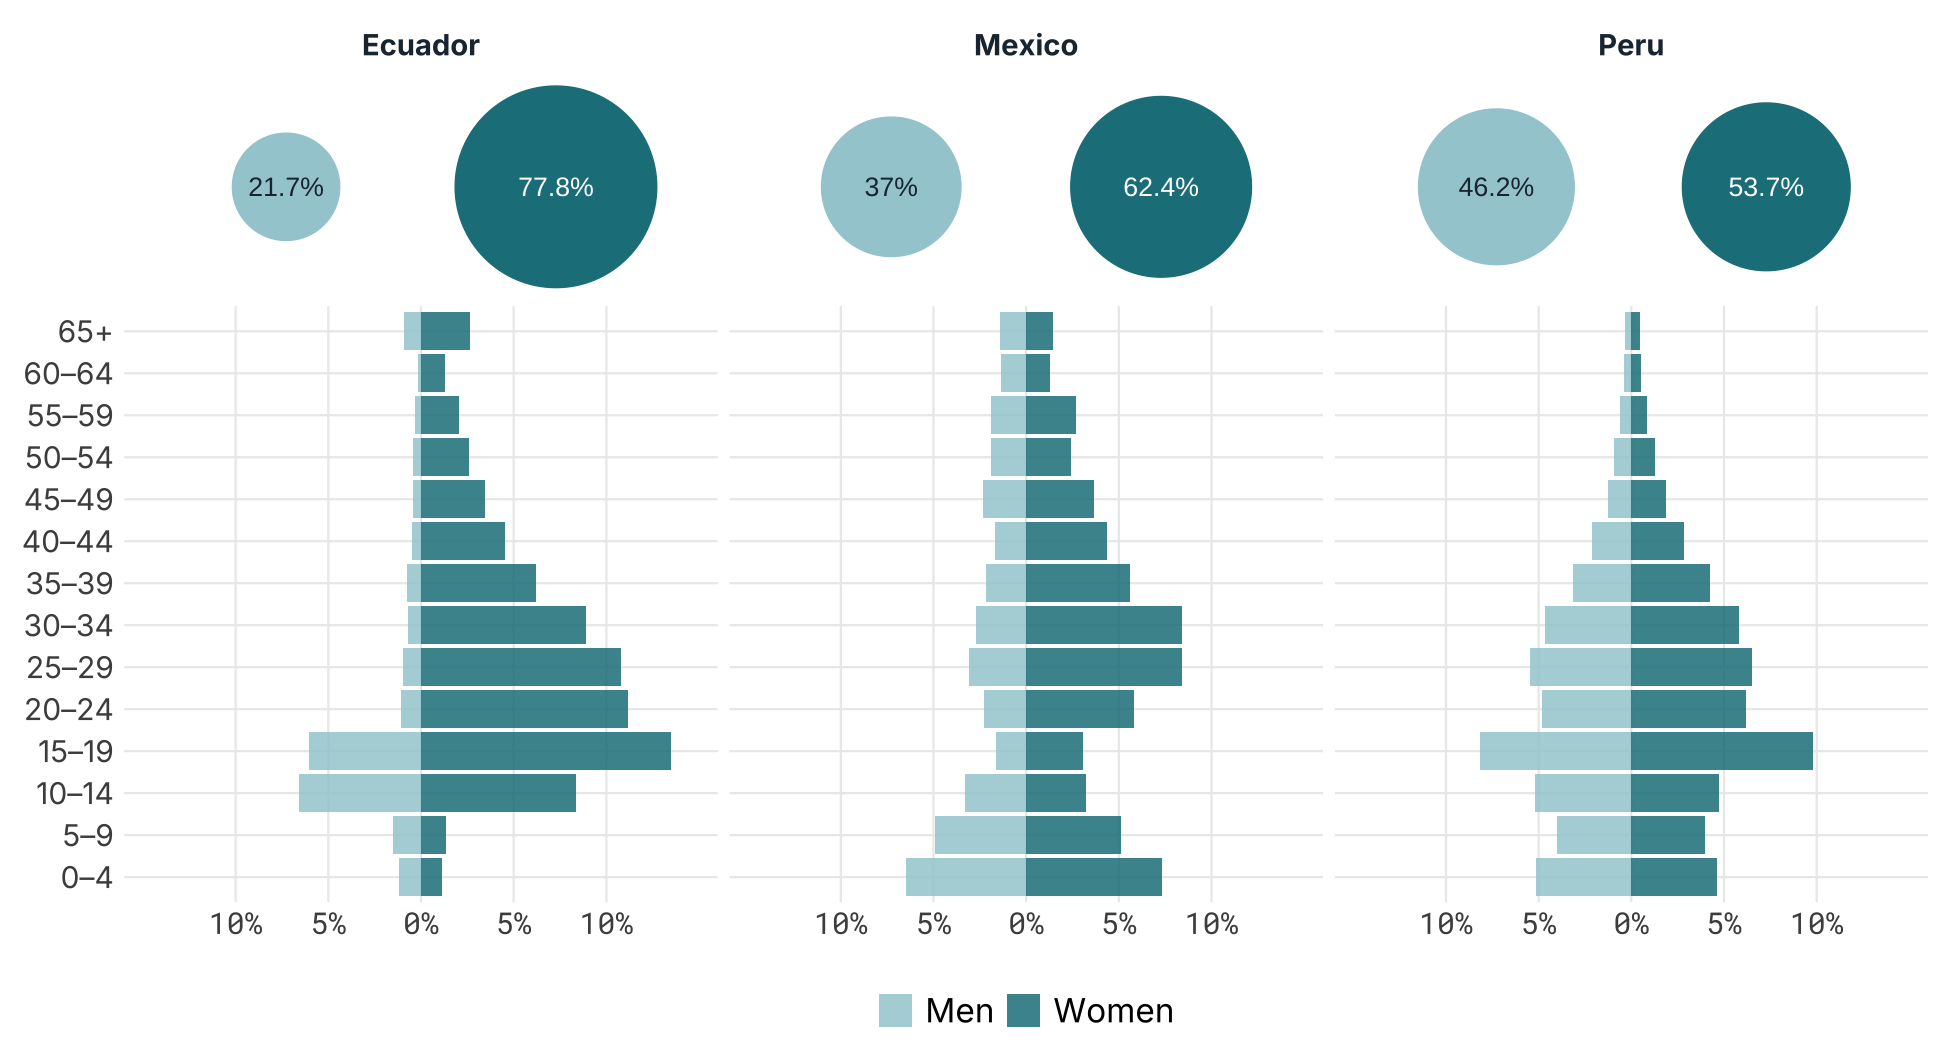
Women make up the large majority of registered clients in all three countries — a pattern driven by the weight of prenatal and sexual and reproductive health services in the caseload. Men are underrepresented relative to their share of the affected population, which is common in humanitarian health programming where male engagement in preventive and reproductive care tends to be lower.
38% of all registered clients are under 18. The age profile across all three countries skews young, with a working-age peak in the 20–34 band — consistent with a caseload that spans mobile migrant adults and their children. Peru’s pyramid is narrower in the older age groups, reflecting a migrant population concentrated among working-age adults, while Ecuador’s broader shape reflects its mixed host-community and migrant caseload.
The dot chart below shows the male/female split by country (other genders account for around 0.3% of clients and are not displayed separately). The population pyramids break this down by five-year age band. Note that Peru and Mexico tend to see more children under 10 than Ecuador, and that in Ecuador the majority of male clients are minors — suggesting adult men primarily access services for their children rather than for themselves.
Figure 3. Who are our clients? Sex and age profile
Dot chart and population pyramid · sex split and five-year age bands by country
The three countries represent three distinct programme models. Ecuador is predominantly a host-community programme: most clients are settled Ecuadorian nationals accessing care they might otherwise struggle to reach. Peru is a transit corridor — most clients are Venezuelan migrants on the move, passing through rather than settling. Mexico sits between the two: roughly a third of clients are Mexican nationals, but the majority are migrants or people in displacement, many of them Venezuelan, Honduran, or Guatemalan, reflecting Ciudad Juárez’s position on the US border. These differences shape everything downstream: the clinical picture, the service design, and how often a client returns for follow-up.
Figure 4. Where are clients coming from?
Dot chart · migration profile by country
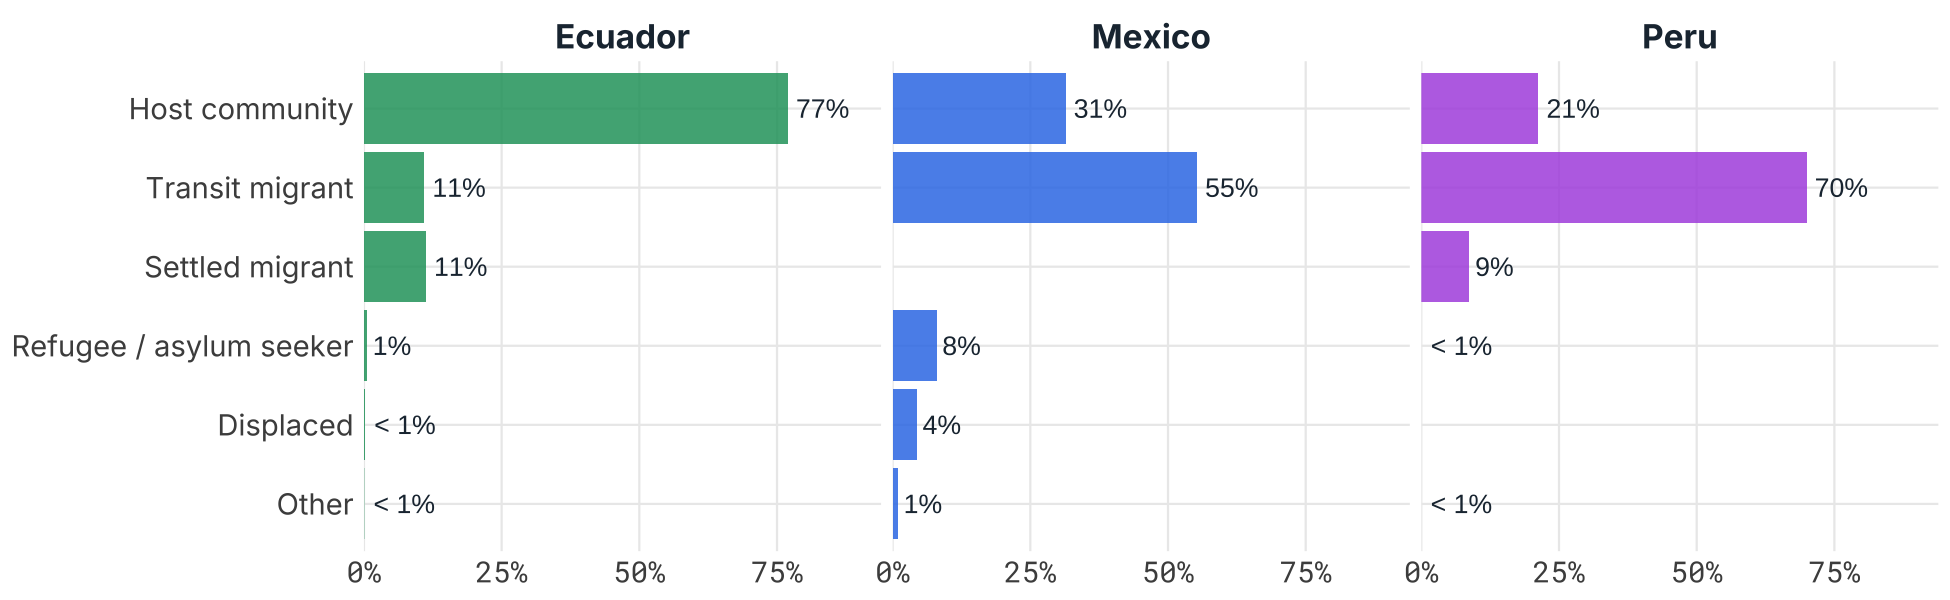
Ecuador serves predominantly its own nationals (84%) alongside Venezuelan and Colombian migrants. Peru’s caseload is majority Venezuelan (55%), reflecting its role as a transit country in the regional displacement crisis. Mexico’s caseload — centred on Ciudad Juárez and Mexico City — is split almost evenly between Mexican nationals and Venezuelan migrants, with significant numbers of Hondurans and Guatemalans reflecting Mexico’s position as both a destination and a transit corridor. The ethnic profile is largely mestizo in Ecuador and Peru. Ethnicity is not collected in Mexico. Indigenous clients make up a small but meaningful share in Ecuador, concentrated in highland and border communities. Hover over the dots to see the counts behind each percentage.
Figure 5. Client nationality and ethnic background
Dot chart · top nationalities and ethnicity by country — hover for counts
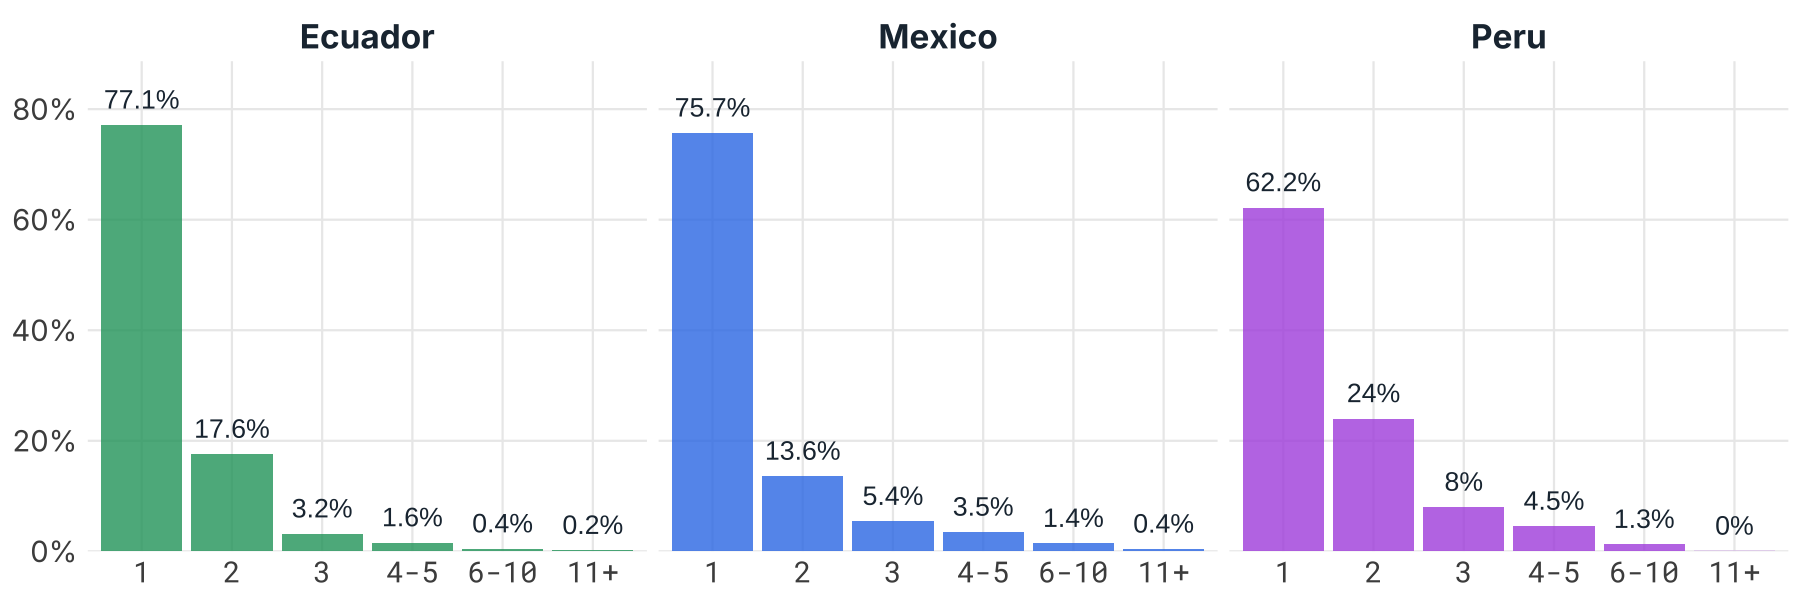
77% of Ecuador clients, 62% of Peru clients, and 76% of Mexico clients received only a single service in the period covered. Peru’s higher return rate — an average of 1.6 services per client — is consistent with a transit setting where clients may remain for weeks and access multiple services. Ecuador and Mexico are closer to a first-contact, onward-referral model, with means of 1.3 and 1.5 services respectively. A high proportion of single-service clients is not a failure of retention — it may simply reflect a programme doing exactly what it is designed to do.
Figure 6. Do clients access multiple services from the IRC (and partners)?
Distribution chart · number of services received per client, by country
Services
Total services
38,118
Ecuador 🇪🇨
18,853
Peru 🇵🇪
16,329
Mexico 🇲🇽
2,936
The IRC delivers services across three clinical domains: primary care, sexual and reproductive health (SRH), and mental health. Primary care is the highest-volume service across all three countries, with SRH services close behind. Mental health is smaller in absolute numbers but represents a significant investment relative to caseload size — the cost-per-client of psychosocial support is higher than a primary care consultation, and the need is acute in displacement-affected populations.
The Sankey chart below shows how each service type breaks down into sub-services, and how those sub-services are distributed across countries. Hover over any node or flow to see the exact counts. Nodes can be dragged to rearrange the layout if any labels overlap.
Figure 7. Preponderance of services in different countries
Sankey chart · service type to sub-service to country — hover or drag nodes
Section 2: Primary care
The bump chart below tracks the ranking of the top five primary care diagnoses by quarter, with dot size reflecting the volume of cases. A diagnosis that stays at #1 across every quarter tells you something important about underlying community need; one that rises and falls is worth watching.
Ecuador’s ranking is notably stable — parasitosis has held the top spot for most of the programme, with UTI a consistent second. These are conditions driven by water quality and sanitation access, which change slowly. Peru shows more movement at the top, with child health checks and headache alternating in the leading position; this variability is consistent with a transit caseload that is still being characterised as the programme matures. Mexico is not shown here because diagnosis coding only began in November 2025; once several full quarters are available it will be added.
Figure 8. What are the top five primary care diagnoses?
Bump chart · quarterly rank among top 5 diagnoses per country · dot size = volume
This chart compares the primary care diagnosis mix between host community clients and migrant/refugee clients. It uses a Marimekko layout: within each panel, bar width reflects the relative size of each population group’s caseload, and bar height reflects the share of diagnoses within that group. A wider bar means that group generates more consultations overall; a taller segment within a bar means that diagnosis is more prominent for that group.
In Ecuador — where both groups are sizeable — this comparison is particularly informative. In Peru, the migrant caseload substantially outweighs the host community caseload, which is reflected in the column widths. Hover over any segment for exact counts and percentages.
Figure 9. Do migrants and host community present with different conditions?
Marimekko chart · bar width = caseload size · bar height = diagnosis share · hover for detail
Section 3: Sexual and reproductive health
Sexual and reproductive health services form a core part of the health package across all three countries. Displacement and transit amplify SRH risks: access to contraception is disrupted, exposure to gender-based violence is elevated, and antenatal care that began in one country often cannot be continued in another. IRC’s SRH presence in these communities fills a gap that formal health systems frequently cannot.
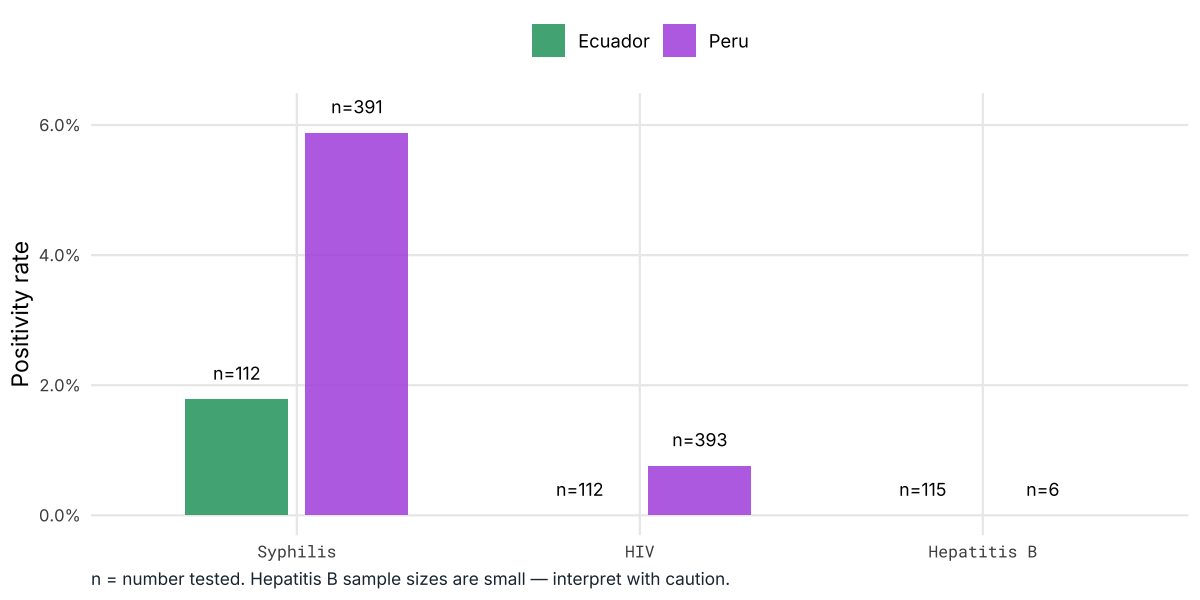
ITS/STI testing results are available for Ecuador and Peru. Syphilis positivity is 5.0% combined. Peru (5.9%) is substantially higher than Ecuador (1.8%) — a clinically significant difference. A positivity rate above 5% is the WHO threshold for a generalised epidemic, placing Peru at that boundary among clients who present for testing. The chart shows test volume (n=) alongside positivity rate; small sample sizes for Hepatitis B mean those figures should be read with caution.
Figure 10. Sexual health screening outcomes
Bar chart · STI test positivity rate by condition and country (Ecuador & Peru only)
11% of prenatal clients are under 18 — a figure that immediately triggers safeguarding protocols. Adolescent pregnancy in a displacement context carries compounded risk: higher exposure to GBV, disrupted family networks, restricted mobility, and interrupted access to antenatal care. For many of these young women, the IRC is the only provider they can reach. The dot chart below shows the age distribution of prenatal clients by country; highlighted dots mark the under-18 age bands. Dot size reflects the number of clients in each band.
Figure 11. Age profile of antenatal clients
Bubble matrix · prenatal clients by age band and country
Section 4: Mental health (Ecuador and Peru only)
Mental health services are delivered through a task-sharing model, with community-based psychosocial support as the primary modality — consistent with mhGAP-aligned programming that keeps care accessible without requiring specialist staff. Mexico does not currently operate a mental health module, so the charts in this section cover Ecuador and Peru only. The diagnostic picture in both countries reflects the trauma-related conditions that are prevalent in displacement-affected populations.
As with primary care, the bump chart below tracks quarterly rankings among the top five mental health diagnoses. Stability in the rankings suggests a well-understood, consistent caseload. Large shifts — a condition jumping from #4 to #1 in a single quarter — may reflect a population change, a programme expansion, or a shift in clinician recording practice worth investigating.
Acute stress reaction dominates the Peru caseload, consistent with a transit population experiencing acute crisis. Ecuador’s picture is more diffuse, with psychosocial and family support conditions prominent alongside clinical diagnoses — consistent with a more settled population where chronic distress, rather than acute trauma, is the primary driver.
Figure 12. What are the top five mental health diagnoses?
Bump chart · quarterly rank among top 5 MH diagnoses per country · dot size = volume
The same Marimekko layout used for primary care diagnoses appears here for mental health. Bar width reflects relative caseload; bar height reflects the diagnostic mix within each group. The question is whether the conditions that bring migrants to the clinic are different from those that bring host community members — and in Peru, the answer is strikingly clear.
Peru’s migrant caseload is dominated by acute stress reaction, at more than six times the volume of the host community caseload, and concentrated in crisis-related diagnoses. Host community clients, by contrast, present more often with anxiety and depressive conditions — the more chronic end of the mental health spectrum. This is exactly what a transit corridor model would predict: migrants arrive in acute distress; settled residents carry the accumulated burden of long-term adversity.
Figure 13. Does the mental health picture differ between migrants and host community?
Marimekko chart · bar width = caseload size · bar height = diagnosis share · hover for detail
Section 5: Pharmaceutical dispensing (Mexico only)
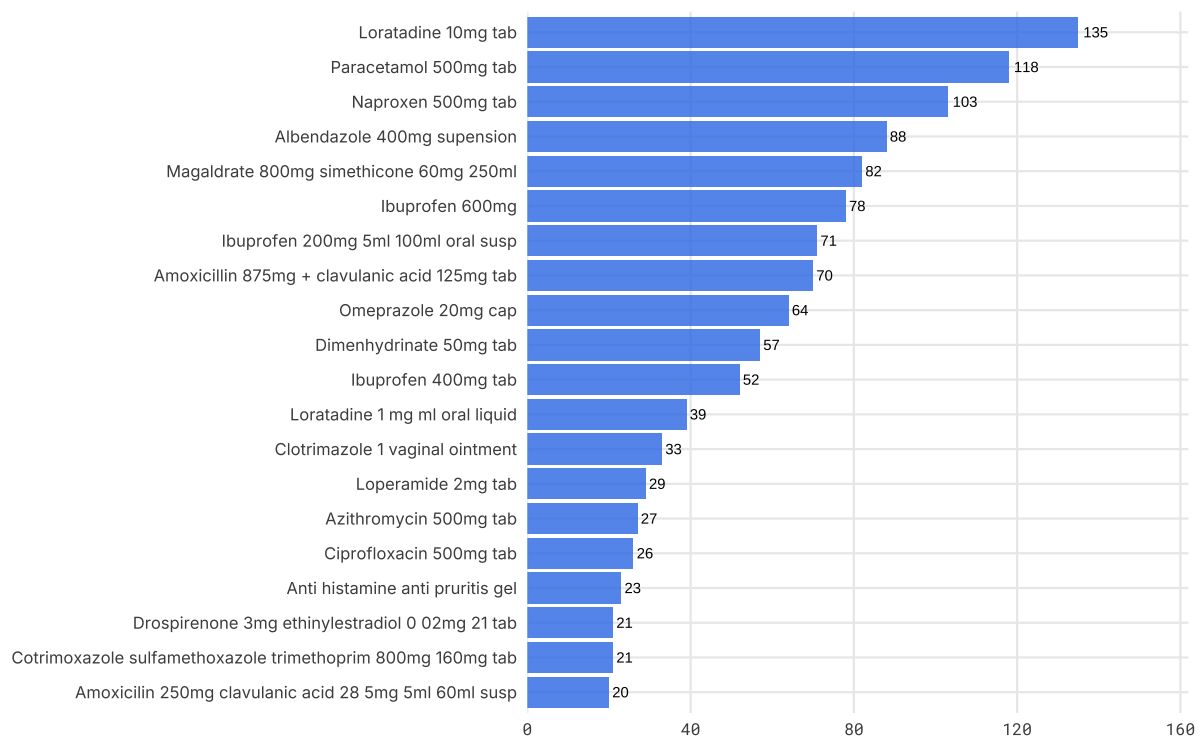
Pharmaceutical dispensing records are available for Mexico only — Ecuador and Peru do not currently capture this in their data systems. The top products dispensed are a useful cross-check on the clinical picture: they should broadly reflect the primary care and SRH diagnosis mix. Analgesics, antibiotics, and contraceptives dominate, which is consistent with a programme that sees a high volume of primary care consultations and family planning services. Unexpected entries — a medication that appears far more often than the diagnosis profile would suggest — may indicate a recording issue or a community need that is not being fully captured in the consultation data.
Figure 14. What medications are being dispensed?
Bar chart · top 20 products dispensed · Mexico only
Further information and resources
For questions about the data, methodology, or client reach across Latin America, please contact:
- Health Technical Adviser: Bibiana Wanger
- Philip Blue, Regional Measurement Adviser, Latin America
- Mark Montague, Deputy Director, MEAL
Data are drawn from IRC’s CommCare health information system. Pipeline code and aggregation scripts are maintained by the MEAL team. For access to underlying aggregated data, contact Philip Blue.